
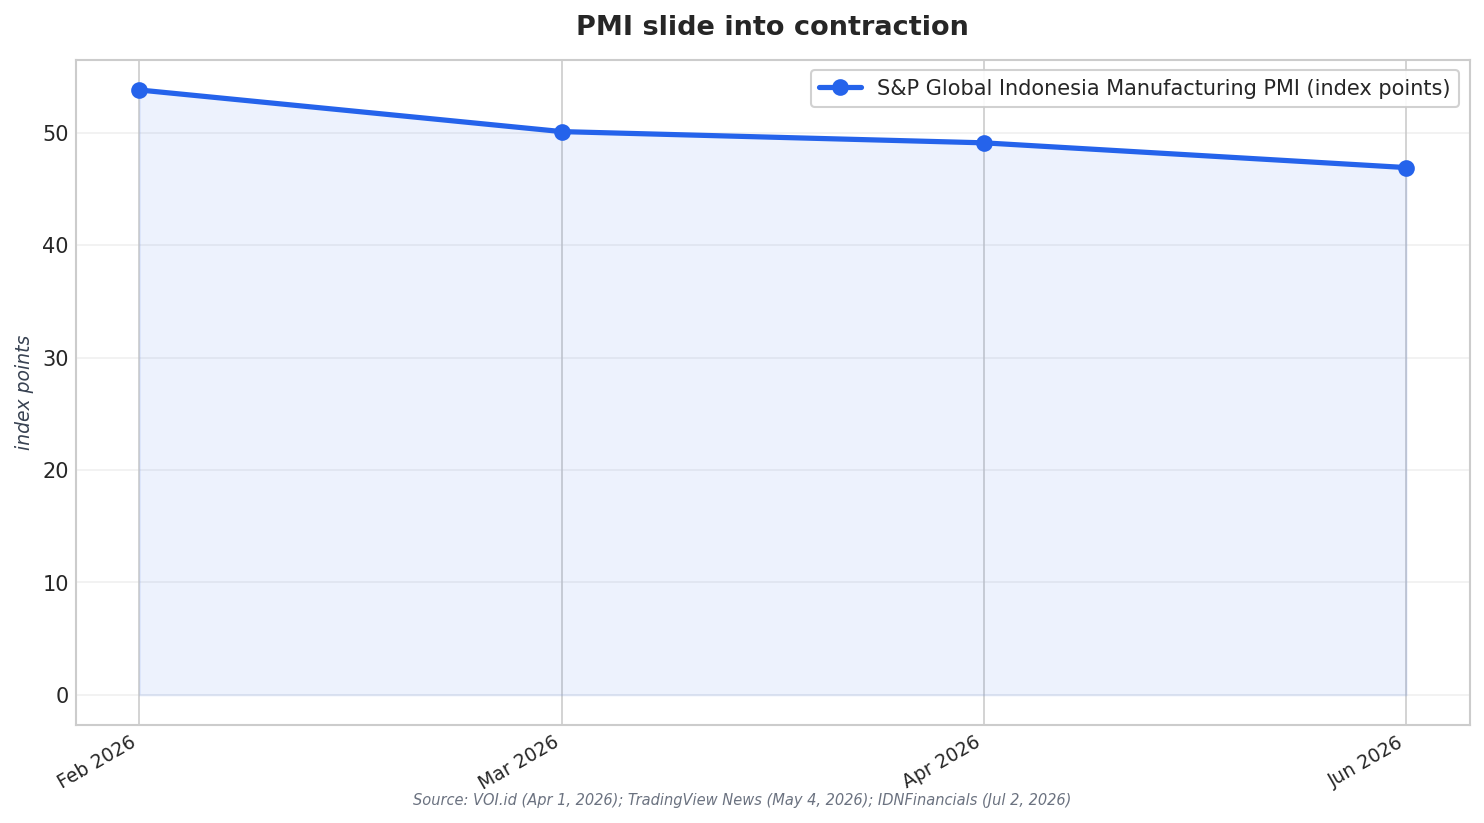
Indonesia’s factory pulse shifted fast in 2026, and the PMI path tells the story. In March 2026, S&P Global’s Indonesia Manufacturing PMI fell sharply to 50.1 from 53.8 in February, a move described as “almost stagnant” operating conditions. That same March survey also pointed to renewed declines in output and new orders, with S&P Global Market Intelligence economist Usamah Bhatti noting the sharpest decline in output in nine months. In April 2026, the PMI edged down again to 49.1 from 50.1, marking the first contraction in nine months and the lowest level since June 2025. By June 2026, the PMI plunged to 46.9, a one-year low that signals a solid worsening in factory operating conditions.
For investors, the risk is not just the headline number but what sits underneath it. As the June 2026 reports stressed, weaker demand for Indonesian manufactured goods drove the downturn. New orders fell for the first time in three months and at the fastest pace in a year, while the renewed decline in new orders led to the sharpest fall in output volumes since April 2025. Companies responded by cutting output for a fourth consecutive month, and S&P described the contraction as the sharpest since April 2025. If you are assessing industrial exposure, this pattern matters because order pipelines are a leading signal, while production, employment, and purchasing decisions tend to follow.
What the PMI Sub-Indexes Reveal About Stress Points
The Indonesia manufacturing PMI decline also came with operational signals that investors typically watch for turning points. In March 2026, one report noted that new orders cooled for the first time in eight months and export demand reversed after rising in February. It also pointed to factories buying less raw material, framing it as a forward-looking sign. Supply-chain friction appeared again: delivery delays worsened to the most severe level since October 2021. By April 2026, separate coverage linked the PMI drop to inflationary pressure and supply disruptions tied to the Middle East conflict, with firms reducing workforce and purchasing activity and warnings about the risk of layoffs.
June 2026 added clearer labor, purchasing, and price signals. S&P highlighted that manufacturers cut employment further in June, with the pace of job cuts described as solid and the steepest since September 2021. Input purchasing declined for a fourth consecutive month and at the fastest pace since August 2021, while inventories also declined in line with weakening demand. Some companies cited rising raw material prices constraining purchasing. On pricing, S&P’s Bhatti said price pressures remain historically elevated, with the current pace of inflation the second-highest on record and linked to the strongest increase in factory selling prices in nearly 13 years. Another report also tied demand destruction to aggressive inflationary pressures, citing raw material shortages and a weak rupiah raising the cost of US dollar-denominated imports.
So what should investors take from this? First, the PMI’s drop from near-neutral in May (50.0) to deeper contraction in June (46.9) suggests momentum is fracturing rather than merely cooling. Second, the combination of falling new orders, a sharp fall in output volumes, and workforce reductions increases the risk of weaker earnings conditions for industrial-linked exposures. Finally, the June commentary frames the PMI as a leading indicator built on purchasing managers’ views of upcoming order pipelines, making it relevant for timing. Even with notes of optimism in forward expectations from manufacturers reported in March, the near-term data flow in April and June points to deteriorating conditions that warrant tighter monitoring.
What does the recent PMI slide suggest about Indonesia’s manufacturing outlook for investors?
How severe was the June 2026 downturn in new orders and output?
What operational red flags appeared alongside the Indonesia manufacturing PMI decline?
Are prices and inflation part of the PMI problem in 2026?