
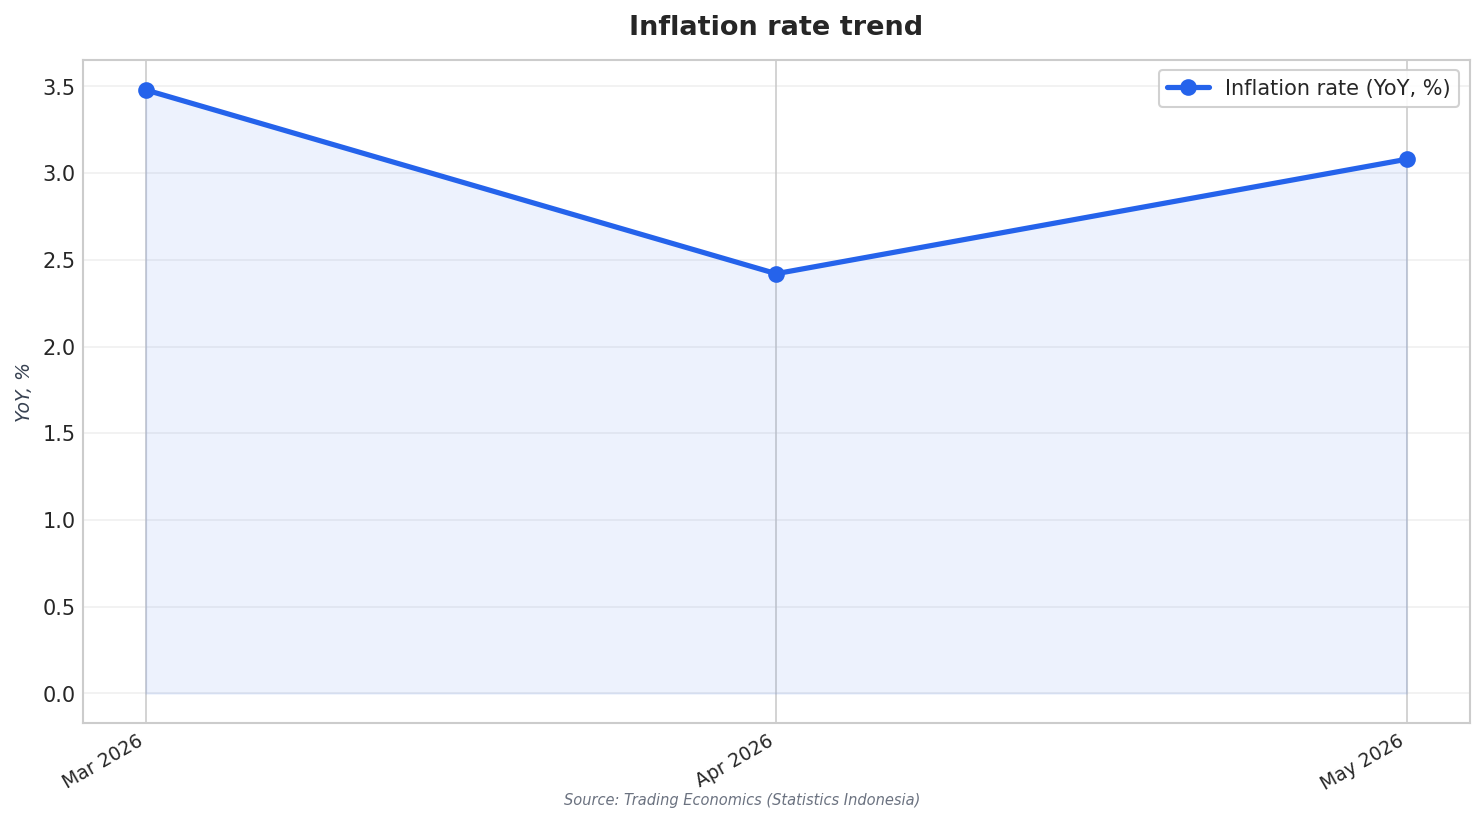
Talk of an Indonesia deflation 2026 theme is best understood as a category story, not a single national headline. In March 2026, annual inflation eased to 3.48% from 4.76% in February, staying within the central bank’s 1-1/2%–3-1/2% target range. By May 2026, inflation accelerated to 3.08% from 2.42% in April, again within the target range and above market expectations of 2.97%. Monthly CPI also firmed in May, rising 0.28% versus 0.13% in April, which matters for short-cycle businesses watching near-term consumer traction.
Where “falling prices” show up clearly is inside specific baskets, led by communication. Trading Economics noted deflation in communication costs lingering at -0.19% (from -0.28%), while another read showed communication almost flat at -0.03% (from -0.09%). FocusEconomics also reported that communication continued to experience deflation, falling -0.64% year on year in April. For businesses exposed to telecoms, devices, or consumer subscription spending, persistent price declines can point to intense competition, rapid product cycles, or demand that is not strong enough to sustain price increases.
What the Mixed Inflation Picture Signals for Demand
At the same time, other categories were pushing inflation higher, which complicates demand reading. In May 2026, food prices rose 4.94% year on year versus 3.06% in April, described as the most since last October and linked to higher staple costs and elevated distribution expenses across several regions. Additional upward pressure was seen in housing (1.0% vs 0.74%), transport (2.30% vs 1.61%), and restaurants (2.34% vs 1.93%). Core inflation, which strips out volatile food and administered prices, quickened to 2.59% from 2.44%. For businesses, that split suggests essentials can squeeze discretionary demand even when some categories still face deflation.
Demand signals from activity indicators lean cautious and uneven. Trading Economics listed consumer confidence at 121 in May 2026, down from 123 previously, while business confidence was 10.11 in March 2026 versus 10.61. The Manufacturing PMI was 50 in May 2026, up from 49.1, implying a move back to a neutral line rather than a clear surge. Retail can also read as soft: FocusEconomics cited retail sales falling 3.2% year on year in May after a 3.7% fall, and Trading Economics showed retail sales month on month at -11.6% in April 2026 after 10.3% previously. In a mixed inflation environment, that kind of patchy demand often forces selective discounting instead of broad-based pricing power.
Strategy in this environment is about separating “deflation-prone” categories from “cost-push” categories. If your revenue is tied to communication-related pricing, recurring deflation readings like -0.64% year on year suggest you may need to prioritize volume, bundles, or service differentiation over headline price rises. If you sell into food, transport, housing-adjacent supply chains, or restaurants, the May readings (food 4.94%, transport 2.30%, restaurants 2.34%) argue for tighter cost management and faster repricing cycles. With Indonesia’s policy rate listed at 5.75% in June 2026 (from 5.5%), and inflation still in the target band, businesses may find that the strongest demand insights come from category CPI and retail trends, not a single macro label.
Is Indonesia experiencing deflation in 2026?
What does communication-sector deflation imply for business demand?
Which categories pushed inflation higher in May 2026?
How did retail sales and sentiment look around mid-2026?